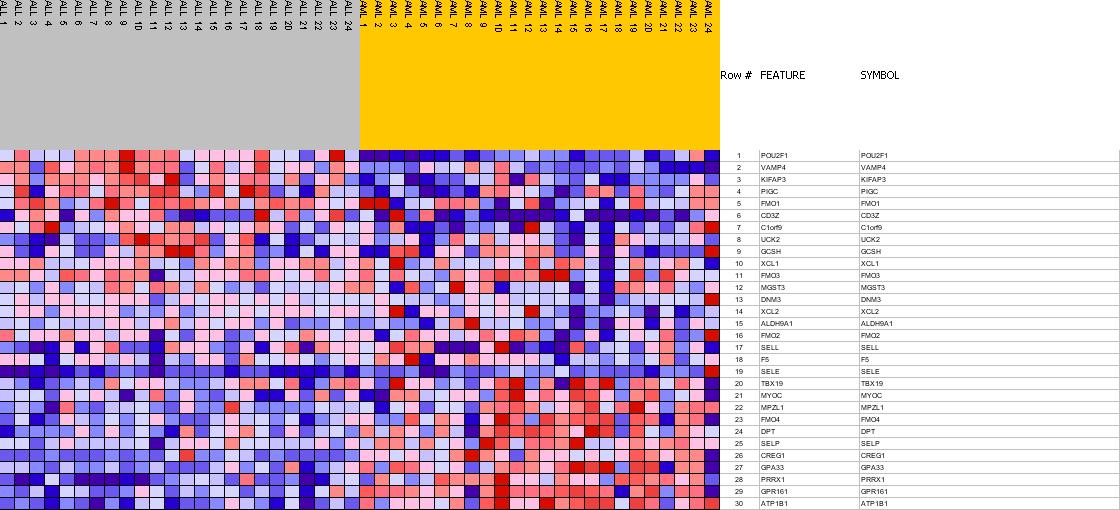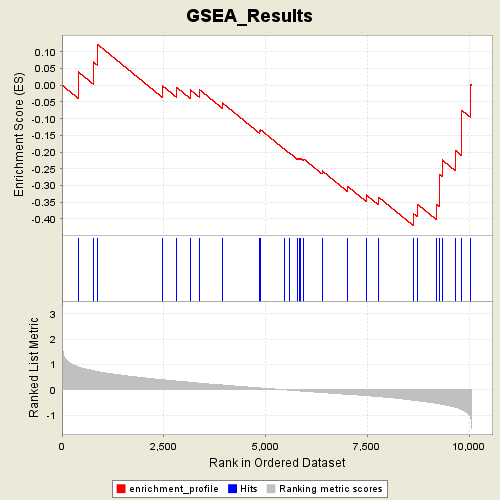
Profile of the Running ES Score & Positions of GeneSet Members on the Rank Ordered List
| Dataset | Leukemia_collapsed.gct |
| Phenotype | AML |
| GeneSet | C1.symbols.gmt#chr1q24 |
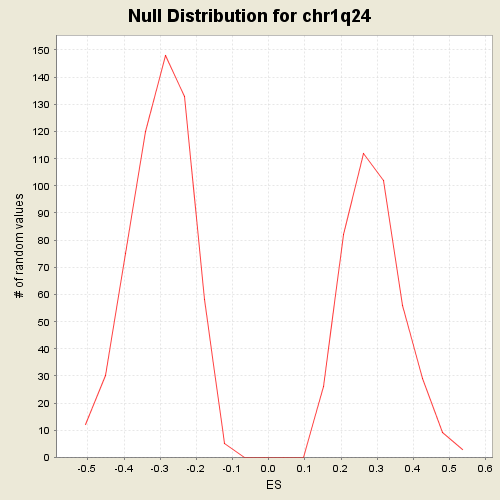
| Enrichment Score (ES) | -0.42083794 |
| Normalized Enrichment Score (NES) | -1.40412 |
| Nominal p-value | 0.0757315 |
| FDR q-value | 1.0 |
| FWER p-Value | 0.889 |
| PROBE | GENE SYMBOL | GENE_TITLE | RANK IN GENE LIST | RANK METRIC SCORE | RES | CORE_ENRICHMENT | |
|---|---|---|---|---|---|---|---|
| 1 | POU2F1 | POU2F1 StanfordSource, GeneCards | POU domain, class 2, transcription factor 1 | 399 | 0.907 | 0.0397 | No |
| 2 | VAMP4 | VAMP4 StanfordSource, GeneCards | vesicle-associated membrane protein 4 | 765 | 0.756 | 0.0696 | No |
| 3 | KIFAP3 | KIFAP3 StanfordSource, GeneCards | kinesin-associated protein 3 | 871 | 0.718 | 0.1220 | No |
| 4 | PIGC | PIGC StanfordSource, GeneCards | phosphatidylinositol glycan, class C | 2462 | 0.400 | -0.0015 | No |
| 5 | FMO1 | FMO1 StanfordSource, GeneCards | flavin containing monooxygenase 1 | 2823 | 0.341 | -0.0075 | No |
| 6 | CD3Z | CD3Z StanfordSource, GeneCards | CD3Z antigen, zeta polypeptide (TiT3 complex) | 3148 | 0.297 | -0.0138 | No |
| 7 | C1orf9 | C1orf9 StanfordSource, GeneCards | chromosome 1 open reading frame 9 | 3374 | 0.261 | -0.0134 | No |
| 8 | UCK2 | UCK2 StanfordSource, GeneCards | uridine-cytidine kinase 2 | 3936 | 0.188 | -0.0528 | No |
| 9 | GCSH | GCSH StanfordSource, GeneCards | glycine cleavage system protein H (aminomethyl carrier) | 4843 | 0.075 | -0.1366 | No |
| 10 | XCL1 | XCL1 StanfordSource, GeneCards | chemokine (C motif) ligand 1 | 4864 | 0.073 | -0.1322 | No |
| 11 | FMO3 | FMO3 StanfordSource, GeneCards | flavin containing monooxygenase 3 | 5467 | -0.001 | -0.1922 | No |
| 12 | MGST3 | MGST3 StanfordSource, GeneCards | microsomal glutathione S-transferase 3 | 5584 | -0.015 | -0.2025 | No |
| 13 | DNM3 | DNM3 StanfordSource, GeneCards | dynamin 3 | 5773 | -0.038 | -0.2179 | No |
| 14 | XCL2 | XCL2 StanfordSource, GeneCards | chemokine (C motif) ligand 2 | 5820 | -0.042 | -0.2188 | No |
| 15 | ALDH9A1 | ALDH9A1 StanfordSource, GeneCards | aldehyde dehydrogenase 9 family, member A1 | 5859 | -0.049 | -0.2183 | No |
| 16 | FMO2 | FMO2 StanfordSource, GeneCards | flavin containing monooxygenase 2 | 5939 | -0.060 | -0.2210 | No |
| 17 | SELL | SELL StanfordSource, GeneCards | selectin L (lymphocyte adhesion molecule 1) | 6387 | -0.108 | -0.2560 | No |
| 18 | F5 | F5 StanfordSource, GeneCards | coagulation factor V (proaccelerin, labile factor) | 7014 | -0.180 | -0.3027 | No |
| 19 | SELE | SELE StanfordSource, GeneCards | selectin E (endothelial adhesion molecule 1) | 7469 | -0.228 | -0.3280 | No |
| 20 | TBX19 | TBX19 StanfordSource, GeneCards | T-box 19 | 7768 | -0.266 | -0.3344 | No |
| 21 | MYOC | MYOC StanfordSource, GeneCards | myocilin, trabecular meshwork inducible glucocorticoid response | 8636 | -0.412 | -0.3847 | Yes |
| 22 | MPZL1 | MPZL1 StanfordSource, GeneCards | myelin protein zero-like 1 | 8723 | -0.432 | -0.3554 | Yes |
| 23 | FMO4 | FMO4 StanfordSource, GeneCards | flavin containing monooxygenase 4 | 9191 | -0.531 | -0.3555 | Yes |
| 24 | DPT | DPT StanfordSource, GeneCards | dermatopontin | 9261 | -0.547 | -0.3144 | Yes |
| 25 | SELP | SELP StanfordSource, GeneCards | selectin P (granule membrane protein 140kDa, antigen CD62) | 9262 | -0.547 | -0.2664 | Yes |
| 26 | CREG1 | CREG1 StanfordSource, GeneCards | cellular repressor of E1A-stimulated genes 1 | 9333 | -0.568 | -0.2237 | Yes |
| 27 | GPA33 | GPA33 StanfordSource, GeneCards | glycoprotein A33 (transmembrane) | 9663 | -0.693 | -0.1958 | Yes |
| 28 | PRRX1 | PRRX1 StanfordSource, GeneCards | paired related homeobox 1 | 9806 | -0.772 | -0.1423 | Yes |
| 29 | GPR161 | GPR161 StanfordSource, GeneCards | G protein-coupled receptor 161 | 9815 | -0.778 | -0.0749 | Yes |
| 30 | ATP1B1 | ATP1B1 StanfordSource, GeneCards | ATPase, Na+/K+ transporting, beta 1 polypeptide | 10041 | -1.127 | 0.0014 | Yes |