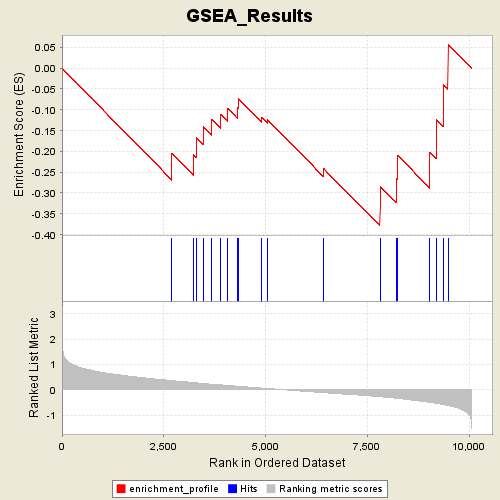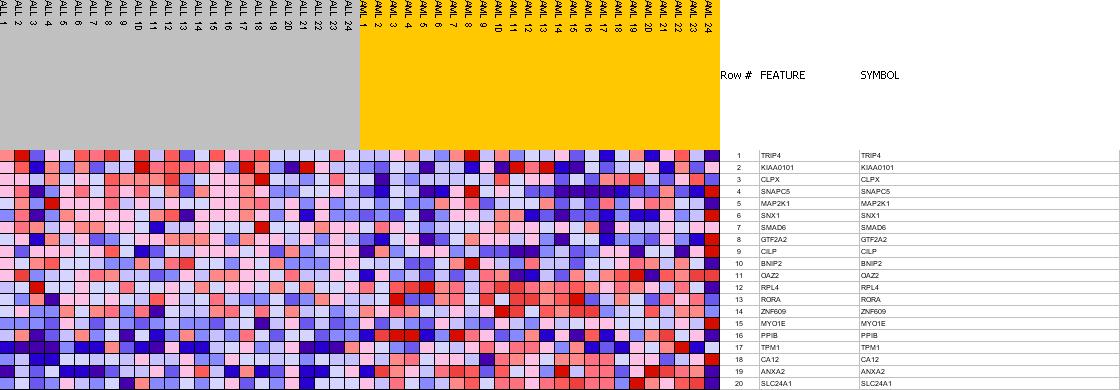
Profile of the Running ES Score & Positions of GeneSet Members on the Rank Ordered List
| Dataset | Leukemia_collapsed.gct |
| Phenotype | AML |
| GeneSet | C1.symbols.gmt#chr15q22 |
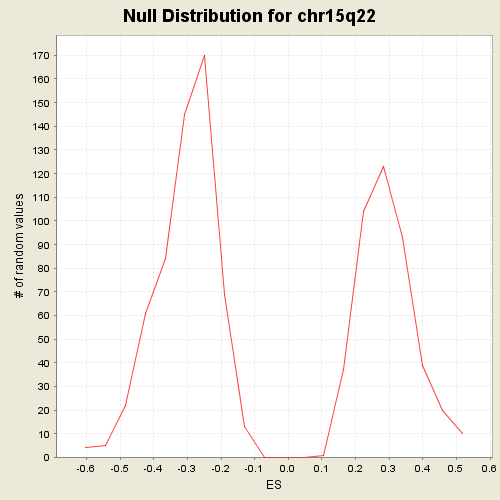
| Enrichment Score (ES) | -0.37926447 |
| Normalized Enrichment Score (NES) | -1.2419978 |
| Nominal p-value | 0.19197208 |
| FDR q-value | 1.0 |
| FWER p-Value | 0.971 |
| PROBE | GENE SYMBOL | GENE_TITLE | RANK IN GENE LIST | RANK METRIC SCORE | RES | CORE_ENRICHMENT | |
|---|---|---|---|---|---|---|---|
| 1 | TRIP4 | TRIP4 StanfordSource, GeneCards | thyroid hormone receptor interactor 4 | 2700 | 0.363 | -0.2053 | No |
| 2 | KIAA0101 | KIAA0101 StanfordSource, GeneCards | KIAA0101 gene product | 3227 | 0.285 | -0.2077 | No |
| 3 | CLPX | CLPX StanfordSource, GeneCards | ClpX caseinolytic protease X homolog (E. coli) | 3304 | 0.273 | -0.1672 | No |
| 4 | SNAPC5 | SNAPC5 StanfordSource, GeneCards | small nuclear RNA activating complex, polypeptide 5, 19kDa | 3476 | 0.247 | -0.1408 | No |
| 5 | MAP2K1 | MAP2K1 StanfordSource, GeneCards | mitogen-activated protein kinase kinase 1 | 3680 | 0.219 | -0.1225 | No |
| 6 | SNX1 | SNX1 StanfordSource, GeneCards | sorting nexin 1 | 3901 | 0.194 | -0.1104 | No |
| 7 | SMAD6 | SMAD6 StanfordSource, GeneCards | SMAD, mothers against DPP homolog 6 (Drosophila) | 4073 | 0.171 | -0.0974 | No |
| 8 | GTF2A2 | GTF2A2 StanfordSource, GeneCards | general transcription factor IIA, 2, 12kDa | 4304 | 0.143 | -0.0953 | No |
| 9 | CILP | CILP StanfordSource, GeneCards | cartilage intermediate layer protein, nucleotide pyrophosphohydrolase | 4333 | 0.138 | -0.0739 | No |
| 10 | BNIP2 | BNIP2 StanfordSource, GeneCards | BCL2/adenovirus E1B 19kDa interacting protein 2 | 4899 | 0.068 | -0.1183 | No |
| 11 | OAZ2 | OAZ2 StanfordSource, GeneCards | ornithine decarboxylase antizyme 2 | 5042 | 0.051 | -0.1234 | No |
| 12 | RPL4 | RPL4 StanfordSource, GeneCards | ribosomal protein L4 | 6425 | -0.111 | -0.2416 | No |
| 13 | RORA | RORA StanfordSource, GeneCards | RAR-related orphan receptor A | 7808 | -0.272 | -0.3316 | Yes |
| 14 | ZNF609 | ZNF609 StanfordSource, GeneCards | Zinc finger protein 609 | 7820 | -0.273 | -0.2848 | Yes |
| 15 | MYO1E | MYO1E StanfordSource, GeneCards | myosin IE | 8213 | -0.331 | -0.2657 | Yes |
| 16 | PPIB | PPIB StanfordSource, GeneCards | peptidylprolyl isomerase B (cyclophilin B) | 8236 | -0.335 | -0.2091 | Yes |
| 17 | TPM1 | TPM1 StanfordSource, GeneCards | tropomyosin 1 (alpha) | 9034 | -0.494 | -0.2017 | Yes |
| 18 | CA12 | CA12 StanfordSource, GeneCards | carbonic anhydrase XII | 9200 | -0.533 | -0.1245 | Yes |
| 19 | ANXA2 | ANXA2 StanfordSource, GeneCards | annexin A2 | 9356 | -0.576 | -0.0389 | Yes |
| 20 | SLC24A1 | SLC24A1 StanfordSource, GeneCards | solute carrier family 24 (sodium/potassium/calcium exchanger), member 1 | 9478 | -0.617 | 0.0575 | Yes |


