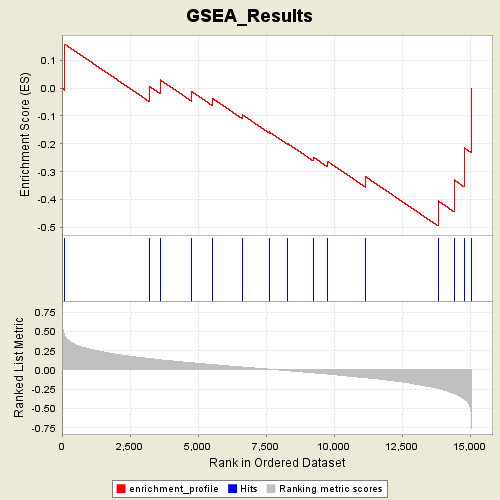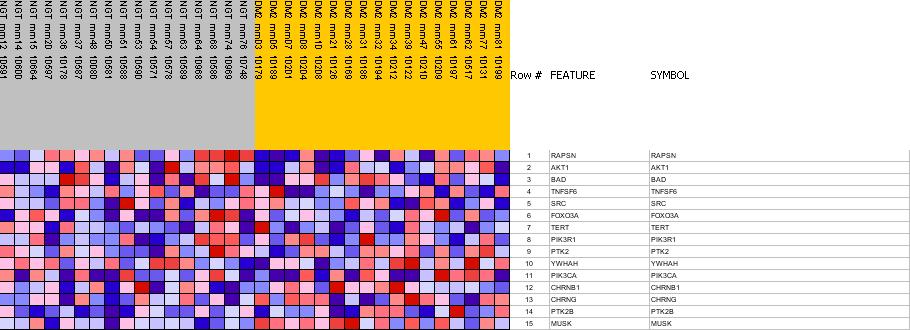
Profile of the Running ES Score & Positions of GeneSet Members on the Rank Ordered List
| Dataset | Diabetes_collapsed.gct |
| Phenotype | DMT |
| GeneSet | C2.symbols.gmt#achPathway |
| Enrichment Score (ES) | -0.4955454 |
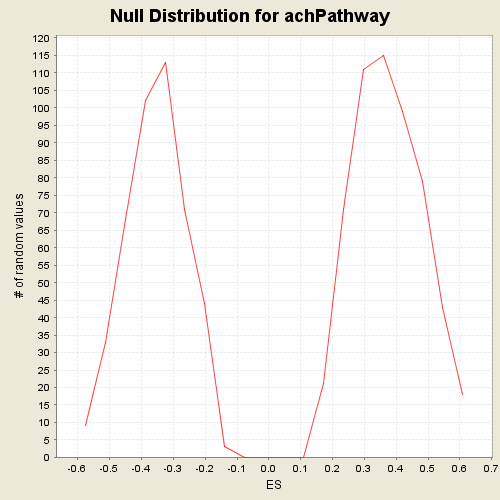
| Normalized Enrichment Score (NES) | -1.3926342 |
| Nominal p-value | 0.07900677 |
| FDR q-value | 1.0 |
| FWER p-Value | 0.989 |
| PROBE | GENE SYMBOL | GENE_TITLE | RANK IN GENE LIST | RANK METRIC SCORE | RES | CORE_ENRICHMENT | |
|---|---|---|---|---|---|---|---|
| 1 | RAPSN | RAPSN StanfordSource, GeneCards | receptor-associated protein of the synapse, 43kD | 109 | 0.441 | 0.1576 | No |
| 2 | AKT1 | AKT1 StanfordSource, GeneCards | v-akt murine thymoma viral oncogene homolog 1 | 3210 | 0.148 | 0.0068 | No |
| 3 | BAD | BAD StanfordSource, GeneCards | BCL2-antagonist of cell death | 3604 | 0.133 | 0.0302 | No |
| 4 | TNFSF6 | TNFSF6 StanfordSource, GeneCards | tumor necrosis factor (ligand) superfamily, member 6 | 4776 | 0.093 | -0.0130 | No |
| 5 | SRC | SRC StanfordSource, GeneCards | v-src sarcoma (Schmidt-Ruppin A-2) viral oncogene homolog (avian) | 5526 | 0.070 | -0.0366 | No |
| 6 | FOXO3A | FOXO3A StanfordSource, GeneCards | forkhead box O3A | 6633 | 0.038 | -0.0960 | No |
| 7 | TERT | TERT StanfordSource, GeneCards | telomerase reverse transcriptase | 7620 | 0.010 | -0.1576 | No |
| 8 | PIK3R1 | PIK3R1 StanfordSource, GeneCards | phosphoinositide-3-kinase, regulatory subunit, polypeptide 1 (p85 alpha) | 8274 | -0.009 | -0.1978 | No |
| 9 | PTK2 | PTK2 StanfordSource, GeneCards | PTK2 protein tyrosine kinase 2 | 9236 | -0.037 | -0.2479 | No |
| 10 | YWHAH | YWHAH StanfordSource, GeneCards | tyrosine 3-monooxygenase/tryptophan 5-monooxygenase activation protein, eta polypeptide | 9755 | -0.052 | -0.2628 | No |
| 11 | PIK3CA | PIK3CA StanfordSource, GeneCards | phosphoinositide-3-kinase, catalytic, alpha polypeptide | 11164 | -0.101 | -0.3186 | No |
| 12 | CHRNB1 | CHRNB1 StanfordSource, GeneCards | cholinergic receptor, nicotinic, beta polypeptide 1 (muscle) | 13826 | -0.241 | -0.4056 | Yes |
| 13 | CHRNG | CHRNG StanfordSource, GeneCards | cholinergic receptor, nicotinic, gamma polypeptide | 14415 | -0.306 | -0.3304 | Yes |
| 14 | PTK2B | PTK2B StanfordSource, GeneCards | PTK2B protein tyrosine kinase 2 beta | 14790 | -0.376 | -0.2148 | Yes |
| 15 | MUSK | MUSK StanfordSource, GeneCards | muscle, skeletal, receptor tyrosine kinase | 15051 | -0.622 | 0.0003 | Yes |


